QuickBooks’ Quick Insight Graphs – Engaging, Effective, Easier
Checking out figures? Numerical ones that is. Good visual graphs make data more engaging & decision making much easier, says the Association of Chartered Certified Accuntants (ACCA). They warn however that ‘with so many different types of charts and graphs available’ presenters should be very cognizant of their audience to ensure they’re using an appropriate scale & chart type. Effective communication is the key.
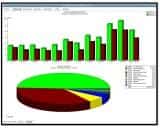 QuickBooks offers “Quick Insight Graphs” which most often displays both a bar graph on the top and a pie chart on the bottom. Graph tool bars allow you to customize each graph and utilize QuickZoom much like as in reports.
Call Chris at (360) 303-5798 for a free business review or if you’d like to know more about using QuickBooks’ Quick Insight Graphs for your business.